必要性
日志收集是微服务可观测性中不可或缺的一部分。日志对于调试问题和监视集群状况非常有用。
虽然我们可以通过 docker logs 或者 kubectl logs 来查看日志信息。但是,如果容器错误了、Pod 被驱逐了或者节点挂了,那么获取的日志将是不完整的。因此,日志应该独立于节点、Pod 和 容器的生命周期,拥有独立的后端存储。并且,一旦日志量大的时候,通过 kubectl logs 查找数据也是相当费力的。因此,日志系统还需要具备分析和查询的能力。
方案
日志收集方案一般来说主要有以下三种方案:
- 在节点上运行一个 agent 来收集日志
- 在 Pod 中包含一个 sidecar 容器来收集应用日志
- 直接在应用程序中将日志信息推送到采集后端
详见 https://kubernetes.io/docs/concepts/cluster-administration/logging/
EFK(Elasticsearch、Fluentd、Kibana)是当下 Kubernetes 中比较流行的日志收集解决方案,也是官方比较推荐的一种方案。
EFK
Elasticsearch 是一个分布式、RESTful 风格的搜索和数据分析引擎,非常适用于索引和搜索大量日志数据。
Kibana 是一个免费且开放的 Elasticsearch 数据可视化 Dashboard。Kibana 允许你通过 web 界面进行各种操作,从跟踪查询负载,到理解请求如何流经您的整个应用,都能轻松完成。
Fluentd 是一个开源的数据收集器,我们可以在 Kubernetes 集群节点上安装 Fluentd,通过获取容器日志文件、过滤和转换日志数据,然后将数据传递到 Elasticsearch 集群,在该集群中对其进行索引和存储。
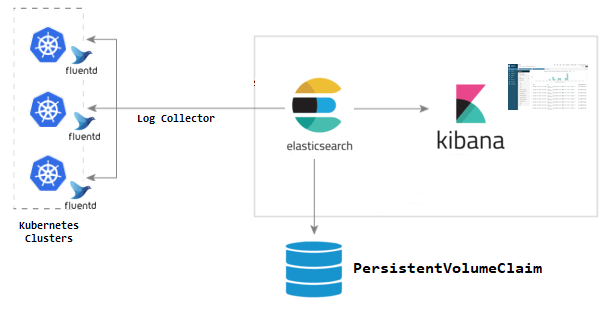
EFK 利用部署在每个节点上的 Fluentd 采集 Kubernetes 节点服务器的 /var/log 和 /var/lib/docker/container 两个目录下的日志,然后传到 Elasticsearch 中。最后,用户通过访问 Kibana 来查询日志。
具体过程如下:
- 创建 Fluentd 并且将 Kubernetes 节点服务器 log 目录挂载进容器。
- Fluentd 采集节点服务器 log 目录下的 containers 里面的日志文件。
- Fluentd 将收集的日志转换成 JSON 格式。
- Fluentd 利用 Exception Plugin 检测日志是否为容器抛出的异常日志,如果是就将异常栈的多行日志合并。
- Fluentd 将换行多行日志 JSON 合并。
- Fluentd 使用 Kubernetes Metadata Plugin 检测出 Kubernetes 的 Metadata 数据进行过滤,如 Namespace、Pod Name 等。
- Fluentd 使用 ElasticSearch Plugin 将整理完的 JSON 日志输出到 ElasticSearch 中。
- ElasticSearch 建立对应索引,持久化日志信息。
- Kibana 检索 ElasticSearch 中 Kubernetes 日志相关信息进行展示。
部署
在部署 EFK 之前,我们先创建一个命名空间(logging),用于存放日志收集相关的资源。
1
kubectl create namespace logging
注:Kubernetes 官方将 EFK 作为 addon 的形式提供,详见 https://github.com/kubernetes/kubernetes/tree/master/cluster/addons/fluentd-elasticsearch。
Elasticsearch
由于 Elasticsearch 需要存储日志数据。因此,需要先为其准备一个 PVC。
注:这里以阿里云静态磁盘为例,如果是其他平台,根据平台创建 PVC 的教程创建即可。
1
2
3
4
5
6
7
8
9
10
11
12
13
14
15
16
17
18
19
20
21
22
23
24
25
26
27
28
29
30
31
32
33
34
35
# es-pvc.yaml
# https://help.aliyun.com/document_detail/128557.html?spm=a2c4g.11186623.6.751.9583639dOYa1vx
apiVersion: v1
kind: PersistentVolume
metadata:
  name: d-wzdswfrdctmdetr1s0hty
  labels:
    alicloud-pvname: d-wzdswfrdctmdetr1s0hty
    failure-domain.beta.kubernetes.io/zone: cn-shenzhen-a
    failure-domain.beta.kubernetes.io/region: cn-shenzhen
spec:
  capacity:
    storage: 100Gi
  accessModes:
    - ReadWriteOnce
  flexVolume:
    driver: "alicloud/disk"
    fsType: "ext4"
    options:
      volumeId: "d-wzdswfrdctmdetr1s0hty"
---
kind: PersistentVolumeClaim
apiVersion: v1
metadata:
  name: elasticsearch-pvc
  namespace: logging
spec:
  accessModes:
    - ReadWriteOnce
  resources:
    requests:
      storage: 20Gi
  selector:
    matchLabels:
      alicloud-pvname: d-wzdswfrdctmdetr1s0hty
接下来,准备 Elasticsearch 部署文件。
注:官网 addon 中 Elasticsearch 以 StatefulSet 部署了多个实例。这里为求简单,使用单节点的 Elasticsearch 形式部署。正式环境中,推荐使用 addon 中的部署方式,提高可用性。
1
2
3
4
5
6
7
8
9
10
11
12
13
14
15
16
17
18
19
20
21
22
23
24
25
26
27
28
29
30
31
32
33
34
35
36
37
38
39
40
41
42
43
44
45
46
47
48
49
50
51
52
53
54
55
56
57
58
59
60
61
62
63
64
65
66
67
68
69
70
71
72
73
74
75
76
77
78
79
80
81
82
83
84
85
86
87
88
89
90
91
92
93
94
95
96
97
98
99
100
101
102
103
104
# es-deployment.yaml
apiVersion: v1
kind: ServiceAccount
metadata:
  name: elasticsearch
  namespace: logging
  labels:
    app: elasticsearch
---
kind: ClusterRole
apiVersion: rbac.authorization.k8s.io/v1
metadata:
  name: elasticsearch
  labels:
    app: elasticsearch
rules:
  - apiGroups:
      - ""
    resources:
      - "services"
      - "namespaces"
      - "endpoints"
    verbs:
      - "get"
---
kind: ClusterRoleBinding
apiVersion: rbac.authorization.k8s.io/v1
metadata:
  namespace: logging
  name: elasticsearch
  labels:
    app: elasticsearch
subjects:
  - kind: ServiceAccount
    name: elasticsearch
    namespace: logging
    apiGroup: ""
roleRef:
  kind: ClusterRole
  name: elasticsearch
  apiGroup: ""
---
apiVersion: apps/v1
kind: Deployment
metadata:
  name: elasticsearch
  namespace: logging
  labels:
    app: elasticsearch
    version: v7.4.2
spec:
  replicas: 1
  selector:
    matchLabels:
      app: elasticsearch
      version: v7.4.2
  template:
    metadata:
      labels:
        app: elasticsearch
        version: v7.4.2
    spec:
      serviceAccountName: elasticsearch
      containers:
        # 使用官方 addon 镜像
        - image: docker.elastic.co/elasticsearch/elasticsearch-oss:7.4.2
          name: elasticsearch
          resources:
            limits:
              memory: "3Gi"
              cpu: 1000m
            requests:
              memory: "2Gi"
              cpu: 100m
          env:
            # 单节点部署
            - name: discovery.type
              value: single-node
            # 命名空间
            - name: NAMESPACE
              valueFrom:
                fieldRef:
                  fieldPath: metadata.namespace
            # 官方 addon 中默认的服务名称是 elasticsearch-logging,因此,这里需要做对应修改,详见 https://github.com/kubernetes/kubernetes/blob/master/cluster/addons/fluentd-elasticsearch/es-image/elasticsearch_logging_discovery.go
            - name: ELASTICSEARCH_SERVICE_NAME
              value: "elasticsearch"
            # 这里部署的是单节点模式,因此,这里需要做对应修改,详见 https://github.com/kubernetes/kubernetes/blob/master/cluster/addons/fluentd-elasticsearch/es-image/elasticsearch_logging_discovery.go
            - name: MINIMUM_MASTER_NODES
              value: "1"
          ports:
            - containerPort: 9200
              name: db
              protocol: TCP
            - containerPort: 9300
              name: transport
              protocol: TCP
          volumeMounts:
            - name: elasticsearch
              mountPath: /data
      volumes:
        - name: elasticsearch
          # PVC 存储
          persistentVolumeClaim:
            claimName: elasticsearch-pvc
1
2
3
4
5
6
7
8
9
10
11
12
13
14
15
# es-service.yaml
apiVersion: v1
kind: Service
metadata:
  name: elasticsearch
  namespace: logging
  labels:
    app: elasticsearch
spec:
  ports:
    - port: 9200
      protocol: TCP
      targetPort: db
  selector:
    app: elasticsearch
执行以下命令,部署 Elasticsearch。
1
2
3
kubectl apply -f es-pvc.yaml
kubectl apply -f es-deployment.yaml
kubectl apply -f es-service.yaml
部署完毕后,可以通过 _cluster/state 接口来检查 Elasticsearch 是否正常运行。使用以下命令将本地端口 9200 转发到 Elasticsearch 对应的端口:
1
kubectl port-forward $(kubectl -n logging get pod -l app=elasticsearch -o jsonpath='{.items[0].metadata.name}') 9200:9200 --namespace=logging
然后,另起一个终端窗口,执行以下请求:
1
curl http://localhost:9200/_cluster/state?pretty
查看,是否有类似以下信息:
1
2
3
4
5
6
7
8
9
10
11
12
13
14
15
16
17
18
19
20
21
22
23
24
25
26
27
28
{
  "cluster_name" : "docker-cluster",
  "cluster_uuid" : "-uCUuWy6SumxRSe08YlkiA",
  "version" : 182,
  "state_uuid" : "QoacqUarTRKEzttbULFOiA",
  "master_node" : "9Ih9yHh_SBiinI9CkODNyA",
  "blocks" : { },
  "nodes" : {
    "9Ih9yHh_SBiinI9CkODNyA" : {
      "name" : "elasticsearch-86c85f5b49-sh285",
      "ephemeral_id" : "HsQLA9BRTgq1EfqZaadweQ",
      "transport_address" : "172.20.0.152:9300",
      "attributes" : { }
    }
  },
  "metadata" : {
    "cluster_uuid" : "-uCUuWy6SumxRSe08YlkiA",
    "cluster_coordination" : {
      "term" : 1,
      "last_committed_config" : [
        "9Ih9yHh_SBiinI9CkODNyA"
      ],
      "last_accepted_config" : [
        "9Ih9yHh_SBiinI9CkODNyA"
      ],
      "voting_config_exclusions" : [ ]
    },
......
若能看到以上信息,表明 Elasticsearch 已部署成功。
Kibana
准备 Kibana 部署文件。
1
2
3
4
5
6
7
8
9
10
11
12
13
14
15
16
17
18
19
20
21
22
23
24
25
26
27
28
29
30
31
32
33
34
35
36
# kibana-deployment.yaml
apiVersion: apps/v1
kind: Deployment
metadata:
  name: kibana
  namespace: logging
  labels:
    app: kibana
spec:
  replicas: 1
  selector:
    matchLabels:
      app: kibana
  template:
    metadata:
      labels:
        app: kibana
    spec:
      containers:
        - name: kibana
          image: docker.elastic.co/kibana/kibana-oss:7.2.0
          resources:
            limits:
              memory: "256Mi"
              cpu: 1000m
            requests:
              memory: "128Mi"
              cpu: 100m
          env:
            - name: ELASTICSEARCH_HOSTS
              # 由于在同一个命名空间内,所以可以直接通过服务名 elasticsearch 访问到 Elasticsearch
              value: http://elasticsearch:9200
          ports:
            - containerPort: 5601
              name: ui
              protocol: TCP
1
2
3
4
5
6
7
8
9
10
11
12
13
14
15
# kibana-service.yaml
apiVersion: v1
kind: Service
metadata:
  name: kibana
  namespace: logging
  labels:
    app: kibana
spec:
  ports:
    - port: 5601
      protocol: TCP
      targetPort: ui
  selector:
    app: kibana
执行以下命令,部署 Kibana。
1
2
kubectl apply -f kibana-deployment.yaml
kubectl apply -f kibana-service.yaml
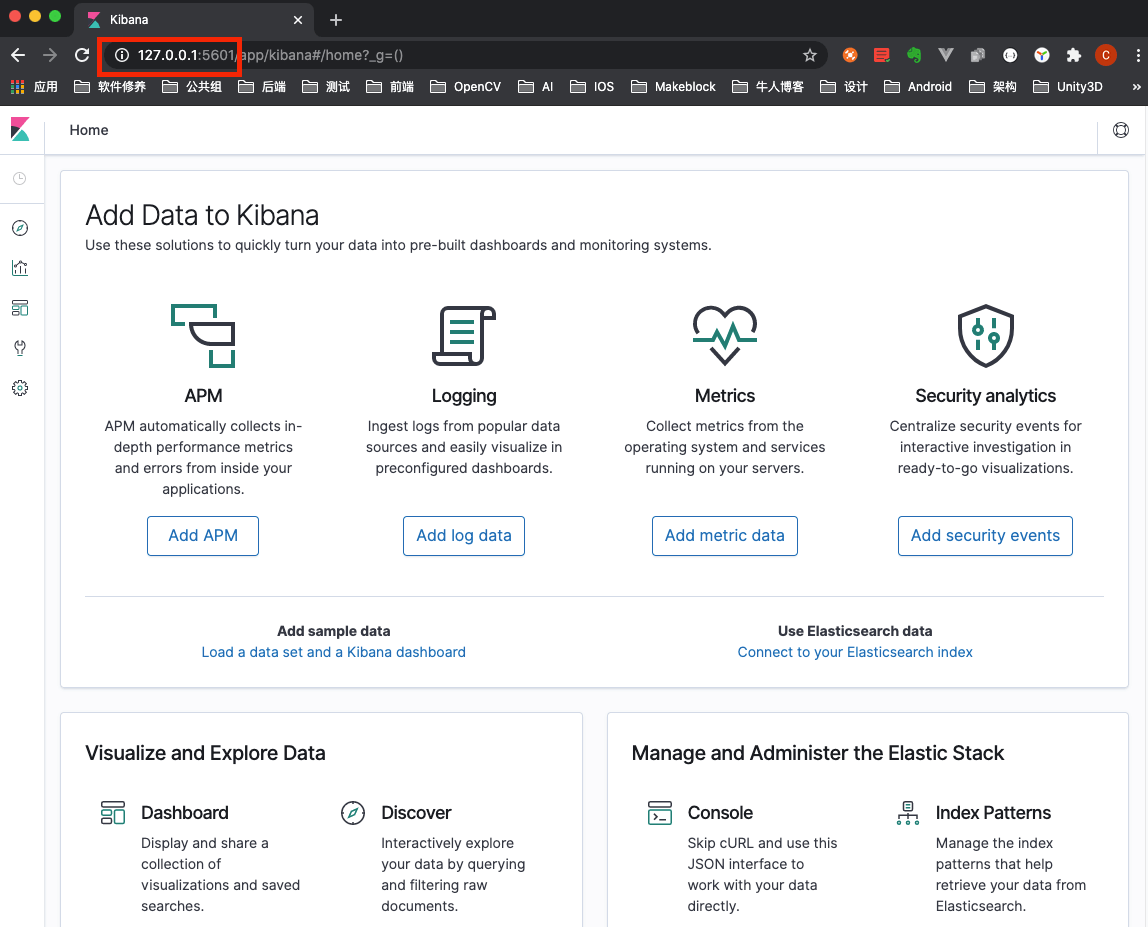
部署完成后,可执行以下命令将本地端口 5601 转发到 Kibana 对应的端口:
1
kubectl -n logging port-forward $(kubectl -n logging get pod -l app=kibana -o jsonpath='{.items[0].metadata.name}') 5601:5601 &
然后访问 http://127.0.0.1:5601 即可看到 Kibana 页面。
Fluentd
部署 Fluentd 需要为其准备 ConfigMap。该 ConfigMap 用来描述 Fluentd 如何采集、处理日志数据。
注:Fluentd 配置项详见 https://docs.fluentd.org/。
1
2
3
4
5
6
7
8
9
10
11
12
13
14
15
16
17
18
19
20
21
22
23
24
25
26
27
28
29
30
31
32
33
34
35
36
37
38
39
40
41
42
43
44
45
46
47
48
49
50
51
52
53
54
55
56
57
58
59
60
61
62
63
64
65
66
67
68
69
70
71
72
73
74
75
76
77
78
79
80
81
82
83
84
85
86
87
88
89
90
91
92
93
94
95
96
97
98
99
100
101
102
103
104
105
106
107
108
109
110
111
112
113
114
115
116
117
118
119
120
121
122
123
124
125
126
127
128
129
130
131
132
133
134
135
136
137
138
139
140
141
142
143
144
145
146
147
148
149
150
151
152
153
154
155
156
157
158
159
160
161
162
163
164
165
166
167
168
169
170
171
172
173
174
175
176
177
178
179
180
181
182
183
184
185
186
187
188
189
190
191
192
193
194
195
196
197
198
199
200
201
202
203
204
205
206
207
208
209
210
211
212
213
214
215
216
217
218
219
220
221
222
223
224
225
226
227
228
229
230
231
232
233
234
235
236
237
238
239
240
241
242
243
244
245
246
247
248
249
250
251
252
253
254
255
256
257
258
259
260
261
262
263
264
265
266
267
268
269
270
271
272
273
274
275
276
277
278
279
280
281
282
283
284
285
286
287
288
289
290
291
292
293
294
295
296
297
298
299
300
301
302
303
304
305
306
307
308
309
310
311
312
313
314
315
316
317
318
319
320
321
322
323
324
325
326
327
328
329
330
331
332
333
334
335
336
337
338
339
340
341
342
343
344
345
346
347
348
349
350
351
352
353
354
355
356
357
358
359
360
361
362
363
364
365
366
367
368
369
370
371
372
373
374
375
376
377
378
379
380
381
382
383
384
385
386
387
388
389
390
391
392
393
394
395
396
397
398
399
400
401
402
403
404
405
406
407
408
409
410
411
412
413
414
415
416
417
418
419
420
421
422
423
# fluentd-es-configmap.yaml
kind: ConfigMap
apiVersion: v1
metadata:
  name: fluentd-es-config-v0.2.0
  namespace: logging
  labels:
    addonmanager.kubernetes.io/mode: Reconcile
data:
  # 系统配置,默认即可
  system.conf: |-
    <system>
      root_dir /tmp/fluentd-buffers/
    </system>

  # 容器日志—收集配置
  containers.input.conf: |-
    # 配置数据源为 tail 模式,不断获取 docker 容器的日志,并标记为 raw.kubernetes.*
    <source>
      @id fluentd-containers.log
      @type tail                                #Fluentd 内置的输入方式,表示不停地从源文件中获取新的日志。https://docs.fluentd.org/input/tail
      path /var/log/containers/*.log            #Docker容器日志地址
      pos_file /var/log/es-containers.log.pos   #存储最近读取日志的位置,https://docs.fluentd.org/input/tail#pos_file-highly-recommended
      tag raw.kubernetes.*                      #设置日志标签
      read_from_head true                       #从头读取日志文件 https://docs.fluentd.org/input/tail#read_from_head
      <parse>                                   #多行格式化成JSON
        @type multi_format                      #使用multi-format-parser解析器插件
        <pattern>
          format json                           #JSON解析器
          time_key time                         #指定事件时间的时间字段
          time_format %Y-%m-%dT%H:%M:%S.%NZ     #时间格式
        </pattern>
        <pattern>
          format /^(?<time>.+) (?<stream>stdout|stderr) [^ ]* (?<log>.*)$/
          time_format %Y-%m-%dT%H:%M:%S.%N%:z
        </pattern>
      </parse>
    </source>
    # 匹配到 raw.kubernetes.* 时,检测异常,并将其作为一条日志转发 https://github.com/GoogleCloudPlatform/fluent-plugin-detect-exceptions
    <match raw.kubernetes.**>                   # 匹配tag为 raw.kubernetes.* 的日志信息
      @id raw.kubernetes
      @type detect_exceptions                   # 使用detect-exceptions插件处理异常栈信息
      remove_tag_prefix raw                     # 移除 raw 前缀
      message log
      stream stream
      multiline_flush_interval 5
      max_bytes 500000
      max_lines 1000
    </match>
    # 拼接多行日志
    <filter **>
      @id filter_concat                         #Fluentd Filter插件,用于连接多个事件中分隔的多行日志。
      @type concat
      key message
      multiline_end_regexp /\n$/
      separator ""
    </filter>
    # 日志中加入 Kubernetes metadata https://github.com/fabric8io/fluent-plugin-kubernetes_metadata_filter
    <filter kubernetes.**>
      @id filter_kubernetes_metadata
      @type kubernetes_metadata
    </filter>
    # 修复 ElasticSearch 中的 JSON 字段 https://github.com/repeatedly/fluent-plugin-multi-format-parser
    <filter kubernetes.**>
      @id filter_parser
      @type parser                              #multi-format-parser多格式解析器插件
      key_name log                              #在要解析的记录中指定字段名称
      reserve_data true                         #在解析结果中保留原始键值对
      remove_key_name_field true                #key_name解析成功后删除字段
      <parse>
        @type multi_format
        <pattern>
          format json
        </pattern>
        <pattern>
          format none
        </pattern>
      </parse>
    </filter>

  # Kubernetes 集群节点机器上的日志收集
  system.input.conf: |-
    # Kubernetes minion节点日志信息,可以去掉
    # Example:
    # 2015-12-21 23:17:22,066 [salt.state       ][INFO    ] Completed state [net.ipv4.ip_forward] at time 23:17:22.066081
    # <source>
    #   @id minion
    #   @type tail
    #   format /^(?<time>[^ ]* [^ ,]*)[^\[]*\[[^\]]*\]\[(?<severity>[^ \]]*) *\] (?<message>.*)$/
    #   time_format %Y-%m-%d %H:%M:%S
    #   path /var/log/salt/minion
    #   pos_file /var/log/salt.pos
    #   tag salt
    # </source>

    # 启动脚本日志,可以去掉
    # Example:
    # Dec 21 23:17:22 gke-foo-1-1-4b5cbd14-node-4eoj startupscript: Finished running startup script /var/run/google.startup.script
    # <source>
    #   @id startupscript.log
    #   @type tail
    #   format syslog
    #   path /var/log/startupscript.log
    #   pos_file /var/log/es-startupscript.log.pos
    #   tag startupscript
    # </source>

    # Docker 程序日志,可以去掉
    # Examples:
    # time="2016-02-04T06:51:03.053580605Z" level=info msg="GET /containers/json"
    # time="2016-02-04T07:53:57.505612354Z" level=error msg="HTTP Error" err="No such image: -f" statusCode=404
    # TODO(random-liu): Remove this after cri container runtime rolls out.
    # <source>
    #   @id docker.log
    #   @type tail
    #   format /^time="(?<time>[^"]*)" level=(?<severity>[^ ]*) msg="(?<message>[^"]*)"( err="(?<error>[^"]*)")?( statusCode=($<status_code>\d+))?/
    #   path /var/log/docker.log
    #   pos_file /var/log/es-docker.log.pos
    #   tag docker
    # </source>

    # ETCD 日志,因为ETCD现在默认启动到容器中,采集容器日志顺便就采集了,可以去掉
    # Example:
    # 2016/02/04 06:52:38 filePurge: successfully removed file /var/etcd/data/member/wal/00000000000006d0-00000000010a23d1.wal
    # <source>
    #   @id etcd.log
    #   @type tail
    #   # Not parsing this, because it doesn't have anything particularly useful to
    #   # parse out of it (like severities).
    #   format none
    #   path /var/log/etcd.log
    #   pos_file /var/log/es-etcd.log.pos
    #   tag etcd
    # </source>

    # Kubelet 日志,可以去掉
    # Multi-line parsing is required for all the kube logs because very large log
    # statements, such as those that include entire object bodies, get split into
    # multiple lines by glog.
    # Example:
    # I0204 07:32:30.020537    3368 server.go:1048] POST /stats/container/: (13.972191ms) 200 [[Go-http-client/1.1] 10.244.1.3:40537]
    # <source>
    #   @id kubelet.log
    #   @type tail
    #   format multiline
    #   multiline_flush_interval 5s
    #   format_firstline /^\w\d{4}/
    #   format1 /^(?<severity>\w)(?<time>\d{4} [^\s]*)\s+(?<pid>\d+)\s+(?<source>[^ \]]+)\] (?<message>.*)/
    #   time_format %m%d %H:%M:%S.%N
    #   path /var/log/kubelet.log
    #   pos_file /var/log/es-kubelet.log.pos
    #   tag kubelet
    # </source>

    # Kube-proxy 日志,可以去掉
    # Example:
    # I1118 21:26:53.975789       6 proxier.go:1096] Port "nodePort for kube-system/default-http-backend:http" (:31429/tcp) was open before and is still needed
    # <source>
    #   @id kube-proxy.log
    #   @type tail
    #   format multiline
    #   multiline_flush_interval 5s
    #   format_firstline /^\w\d{4}/
    #   format1 /^(?<severity>\w)(?<time>\d{4} [^\s]*)\s+(?<pid>\d+)\s+(?<source>[^ \]]+)\] (?<message>.*)/
    #   time_format %m%d %H:%M:%S.%N
    #   path /var/log/kube-proxy.log
    #   pos_file /var/log/es-kube-proxy.log.pos
    #   tag kube-proxy
    # </source>

    # Kube-apiserver 日志,可以去掉
    # Example:
    # I0204 07:00:19.604280       5 handlers.go:131] GET /api/v1/nodes: (1.624207ms) 200 [[kube-controller-manager/v1.1.3 (linux/amd64) kubernetes/6a81b50] 127.0.0.1:38266]
    # <source>
    #   @id kube-apiserver.log
    #   @type tail
    #   format multiline
    #   multiline_flush_interval 5s
    #   format_firstline /^\w\d{4}/
    #   format1 /^(?<severity>\w)(?<time>\d{4} [^\s]*)\s+(?<pid>\d+)\s+(?<source>[^ \]]+)\] (?<message>.*)/
    #   time_format %m%d %H:%M:%S.%N
    #   path /var/log/kube-apiserver.log
    #   pos_file /var/log/es-kube-apiserver.log.pos
    #   tag kube-apiserver
    # </source>

    # Kube-controller 日志,可以去掉
    # Example:
    # I0204 06:55:31.872680       5 servicecontroller.go:277] LB already exists and doesn't need update for service kube-system/kube-ui
    # <source>
    #   @id kube-controller-manager.log
    #   @type tail
    #   format multiline
    #   multiline_flush_interval 5s
    #   format_firstline /^\w\d{4}/
    #   format1 /^(?<severity>\w)(?<time>\d{4} [^\s]*)\s+(?<pid>\d+)\s+(?<source>[^ \]]+)\] (?<message>.*)/
    #   time_format %m%d %H:%M:%S.%N
    #   path /var/log/kube-controller-manager.log
    #   pos_file /var/log/es-kube-controller-manager.log.pos
    #   tag kube-controller-manager
    # </source>

    # Kube-scheduler 日志,可以去掉
    # Example:
    # W0204 06:49:18.239674       7 reflector.go:245] pkg/scheduler/factory/factory.go:193: watch of *api.Service ended with: 401: The event in requested index is outdated and cleared (the requested history has been cleared [2578313/2577886]) [2579312]
    # <source>
    #   @id kube-scheduler.log
    #   @type tail
    #   format multiline
    #   multiline_flush_interval 5s
    #   format_firstline /^\w\d{4}/
    #   format1 /^(?<severity>\w)(?<time>\d{4} [^\s]*)\s+(?<pid>\d+)\s+(?<source>[^ \]]+)\] (?<message>.*)/
    #   time_format %m%d %H:%M:%S.%N
    #   path /var/log/kube-scheduler.log
    #   pos_file /var/log/es-kube-scheduler.log.pos
    #   tag kube-scheduler
    # </source>

    # glbc 日志,可以去掉
    # Example:
    # I0603 15:31:05.793605       6 cluster_manager.go:230] Reading config from path /etc/gce.conf
    # <source>
    #   @id glbc.log
    #   @type tail
    #   format multiline
    #   multiline_flush_interval 5s
    #   format_firstline /^\w\d{4}/
    #   format1 /^(?<severity>\w)(?<time>\d{4} [^\s]*)\s+(?<pid>\d+)\s+(?<source>[^ \]]+)\] (?<message>.*)/
    #   time_format %m%d %H:%M:%S.%N
    #   path /var/log/glbc.log
    #   pos_file /var/log/es-glbc.log.pos
    #   tag glbc
    # </source>

    # 集群伸缩日志,可以去掉
    # Example:
    # I0603 15:31:05.793605       6 cluster_manager.go:230] Reading config from path /etc/gce.conf
    # <source>
    #   @id cluster-autoscaler.log
    #   @type tail
    #   format multiline
    #   multiline_flush_interval 5s
    #   format_firstline /^\w\d{4}/
    #   format1 /^(?<severity>\w)(?<time>\d{4} [^\s]*)\s+(?<pid>\d+)\s+(?<source>[^ \]]+)\] (?<message>.*)/
    #   time_format %m%d %H:%M:%S.%N
    #   path /var/log/cluster-autoscaler.log
    #   pos_file /var/log/es-cluster-autoscaler.log.pos
    #   tag cluster-autoscaler
    # </source>

    # system-journal 日志
    # Logs from systemd-journal for interesting services.
    # TODO(random-liu): Remove this after cri container runtime rolls out.
    <source>
      @id journald-docker
      @type systemd
      matches [{ "_SYSTEMD_UNIT": "docker.service" }]
      <storage>
        @type local
        persistent true
        path /var/log/journald-docker.pos
      </storage>
      read_from_head true
      tag docker
    </source>

    # journald-container-runtime 日志
    <source>
      @id journald-container-runtime
      @type systemd
      matches [{ "_SYSTEMD_UNIT": ".service" }]
      <storage>
        @type local
        persistent true
        path /var/log/journald-container-runtime.pos
      </storage>
      read_from_head true
      tag container-runtime
    </source>

    # journald-kubelet 日志
    <source>
      @id journald-kubelet
      @type systemd
      matches [{ "_SYSTEMD_UNIT": "kubelet.service" }]
      <storage>
        @type local
        persistent true
        path /var/log/journald-kubelet.pos
      </storage>
      read_from_head true
      tag kubelet
    </source>

    # journald-node-problem-detector 日志
    <source>
      @id journald-node-problem-detector
      @type systemd
      matches [{ "_SYSTEMD_UNIT": "node-problem-detector.service" }]
      <storage>
        @type local
        persistent true
        path /var/log/journald-node-problem-detector.pos
      </storage>
      read_from_head true
      tag node-problem-detector
    </source>

    # kernel 日志
    <source>
      @id kernel
      @type systemd
      matches [{ "_TRANSPORT": "kernel" }]
      <storage>
        @type local
        persistent true
        path /var/log/kernel.pos
      </storage>
      <entry>
        fields_strip_underscores true
        fields_lowercase true
      </entry>
      read_from_head true
      tag kernel
    </source>

  # 监听配置,一般用于日志聚合用
  forward.input.conf: |-
    # 监听通过 TCP 发送的消息
    <source>
      @id forward
      @type forward
    </source>

  # Prometheus metrics 数据收集
  monitoring.conf: |-
    # Prometheus Exporter Plugin
    # input plugin that exports metrics
    <source>
      @id prometheus
      @type prometheus
    </source>
    <source>
      @id monitor_agent
      @type monitor_agent
    </source>
    # input plugin that collects metrics from MonitorAgent
    <source>
      @id prometheus_monitor
      @type prometheus_monitor
      <labels>
        host ${hostname}
      </labels>
    </source>
    # input plugin that collects metrics for output plugin
    <source>
      @id prometheus_output_monitor
      @type prometheus_output_monitor
      <labels>
        host ${hostname}
      </labels>
    </source>
    # input plugin that collects metrics for in_tail plugin
    <source>
      @id prometheus_tail_monitor
      @type prometheus_tail_monitor
      <labels>
        host ${hostname}
      </labels>
    </source>

  # 输出配置,在此配置输出到ES的配置信息
  output.conf: |-
    # match kubernetes
    <match kubernetes.**>
      @id elasticsearch_dynamic
      @type elasticsearch_dynamic
      @log_level info
      type_name _doc
      include_tag_key true
      host elasticsearch
      port 9200
      logstash_format true
      # 使用 Kubernetes 命名空间名称作为 prefix,方便日志的管理和查询
      logstash_prefix logstash-${record['kubernetes']['namespace_name']}
      <buffer>
        @type file
        path /var/log/fluentd-buffers/kubernetes-dynamic.system.buffer
        flush_mode interval
        retry_type exponential_backoff
        flush_thread_count 2
        flush_interval 5s
        retry_forever
        retry_max_interval 30
        chunk_limit_size 2M
        total_limit_size 500M
        overflow_action block
      </buffer>
    </match>
    # match others
    <match **>
      @id elasticsearch
      @type elasticsearch
      @log_level info
      type_name _doc
      include_tag_key true
      host elasticsearch
      port 9200
      logstash_format true
      <buffer>
        @type file
        path /var/log/fluentd-buffers/kubernetes.system.buffer
        flush_mode interval
        retry_type exponential_backoff
        flush_thread_count 2
        flush_interval 5s
        retry_forever
        retry_max_interval 30
        chunk_limit_size 2M
        total_limit_size 500M
        overflow_action block
      </buffer>
    </match>
1
2
3
4
5
6
7
8
9
10
11
12
13
14
15
16
17
18
19
20
21
22
23
24
25
26
27
28
29
30
31
32
33
34
35
36
37
38
39
40
41
42
43
44
45
46
47
48
49
50
51
52
53
54
55
56
57
58
59
60
61
62
63
64
65
66
67
68
69
70
71
72
73
74
75
76
77
78
79
80
81
82
83
84
85
86
87
88
89
90
91
92
93
94
95
96
97
98
99
100
# fluentd-es-ds.yaml
apiVersion: v1
kind: ServiceAccount
metadata:
  name: fluentd-es
  namespace: logging
  labels:
    app: fluentd-es
---
kind: ClusterRole
apiVersion: rbac.authorization.k8s.io/v1
metadata:
  name: fluentd-es
  labels:
    app: fluentd-es
rules:
  - apiGroups:
      - ""
    resources:
      - "namespaces"
      - "pods"
    verbs:
      - "get"
      - "watch"
      - "list"
---
kind: ClusterRoleBinding
apiVersion: rbac.authorization.k8s.io/v1
metadata:
  name: fluentd-es
  labels:
    app: fluentd-es
subjects:
  - kind: ServiceAccount
    name: fluentd-es
    namespace: logging
    apiGroup: ""
roleRef:
  kind: ClusterRole
  name: fluentd-es
  apiGroup: ""
---
apiVersion: apps/v1
kind: DaemonSet
metadata:
  name: fluentd-es-v3.0.2
  namespace: logging
  labels:
    app: fluentd-es
    version: v3.0.2
spec:
  selector:
    matchLabels:
      app: fluentd-es
      version: v3.0.2
  template:
    metadata:
      labels:
        app: fluentd-es
        version: v3.0.2
      # This annotation ensures that fluentd does not get evicted if the node
      # supports critical pod annotation based priority scheme.
      # Note that this does not guarantee admission on the nodes (#40573).
      annotations:
        seccomp.security.alpha.kubernetes.io/pod: "docker/default"
    spec:
      # 注释掉抢占式调度,否则报错 Error creating: pods "fluentd-es-v3.0.2-" is forbidden: pods with system-node-critical priorityClass is not permitted in logging namespace
      # priorityClassName: system-node-critical
      serviceAccountName: fluentd-es
      containers:
        - name: fluentd-es
          image: quay.io/fluentd_elasticsearch/fluentd:v3.0.2
          env:
            - name: FLUENTD_ARGS
              value: --no-supervisor -q
          resources:
            limits:
              memory: 500Mi
            requests:
              cpu: 100m
              memory: 200Mi
          volumeMounts:
            - name: varlog
              mountPath: /var/log
            - name: varlibdockercontainers
              mountPath: /var/lib/docker/containers
              readOnly: true
            - name: config-volume
              mountPath: /etc/fluent/config.d
      terminationGracePeriodSeconds: 30
      volumes:
        - name: varlog
          hostPath:
            path: /var/log
        - name: varlibdockercontainers
          hostPath:
            path: /var/lib/docker/containers
        - name: config-volume
          configMap:
            name: fluentd-es-config
执行以下命令,部署 Fluentd。
1
2
kubectl apply -f fluentd-es-configmap.yaml
kubectl apply -f fluentd-es-ds.yaml
查看日志
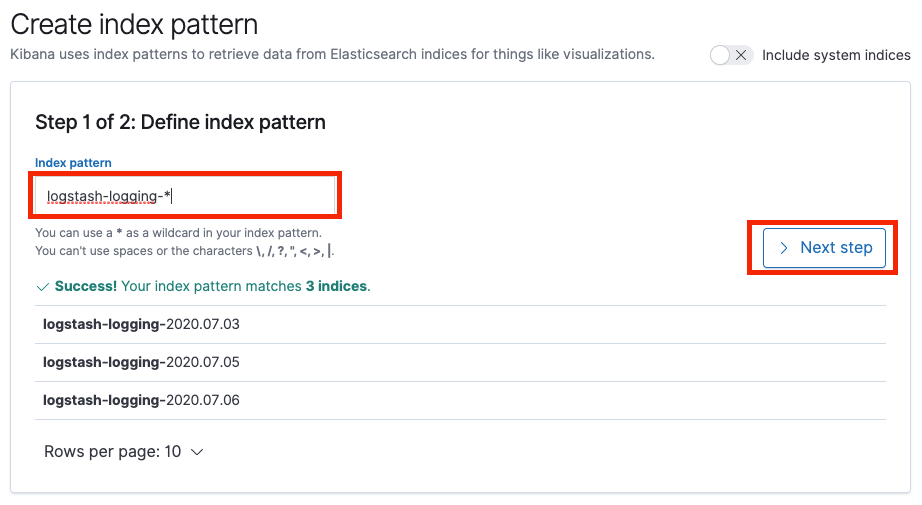
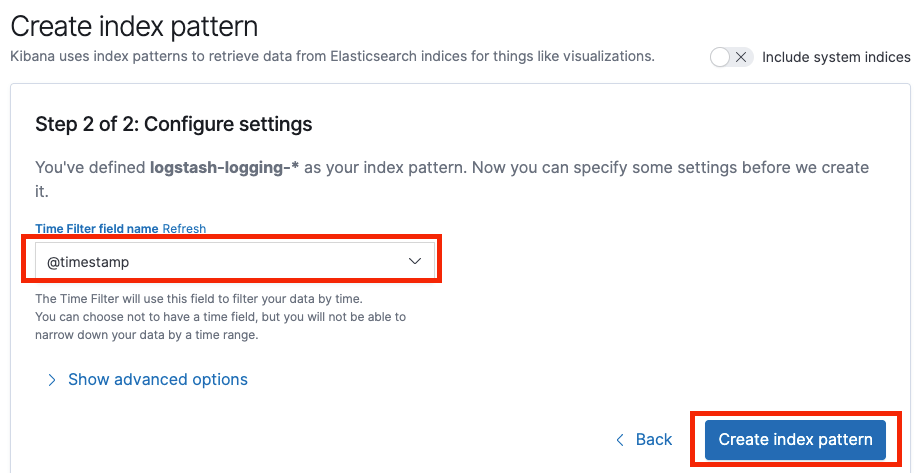
设置 Kibana 索引
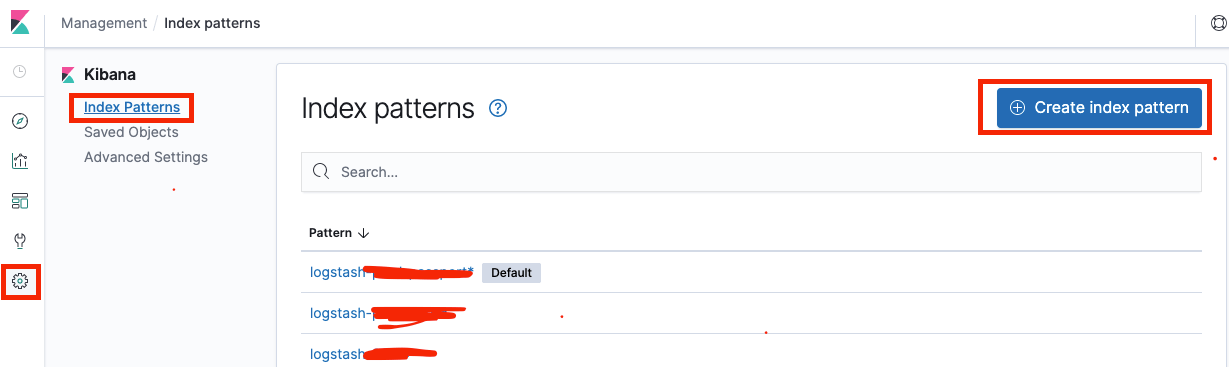
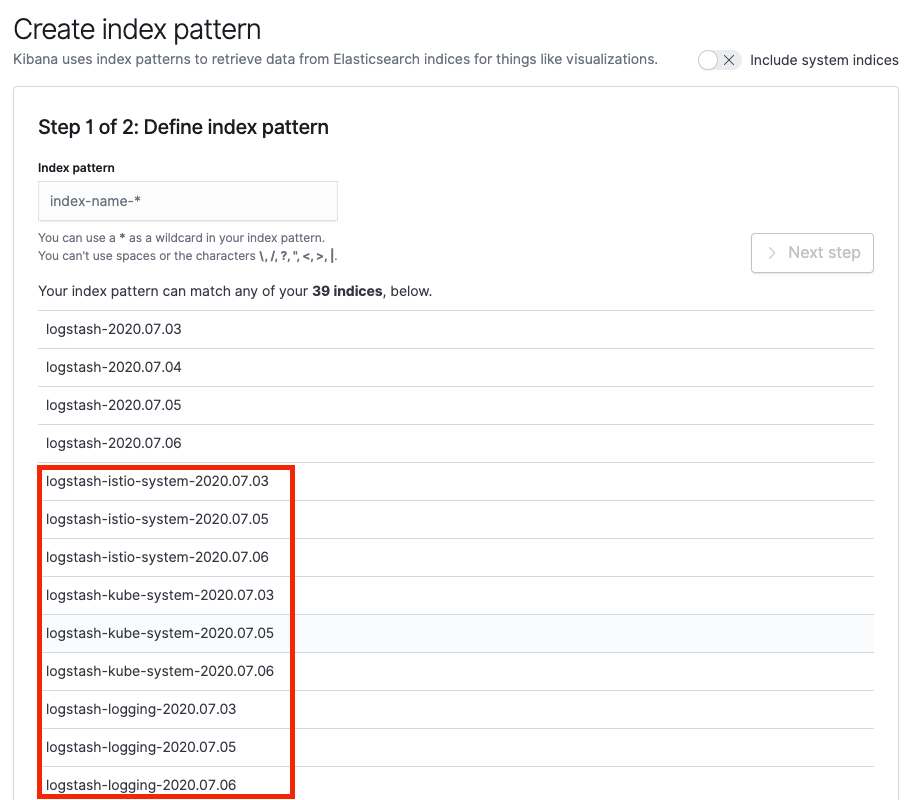
可以看出 Fluented ConfigMap 中配置的按命名空间作为 prefix 生效了。
这时,我们可以按命名空间建立 Kibana 索引,方便日志的查询,下面以 logging 命名空间为例。
查询日志
点击 Discover,选择刚才创建的索引,选择需要显示的字段,即可显示对应的日志信息。
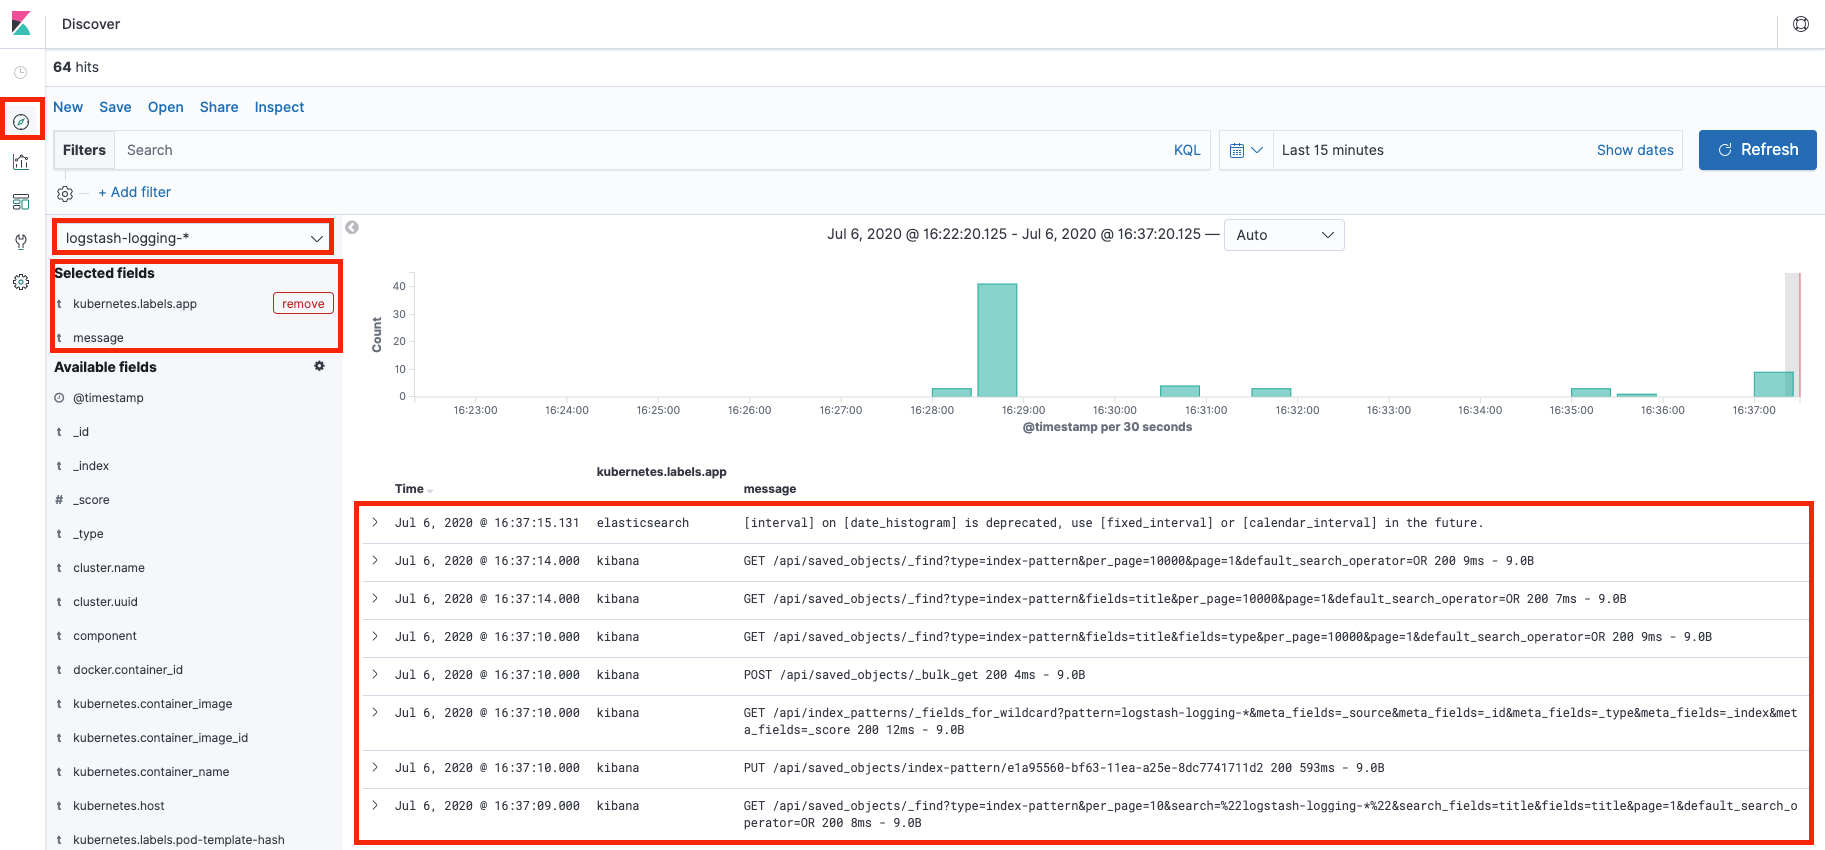
更多的查询条件,可以参考KQL,这里不在赘述。
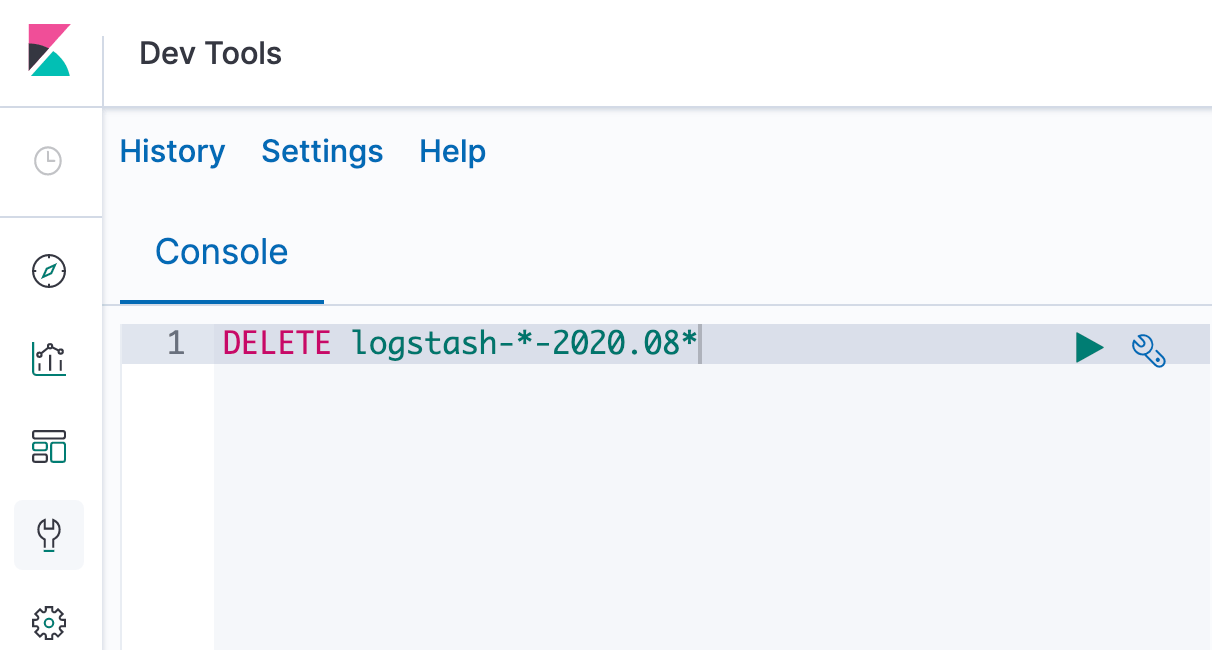
清理日志
可以打开 Kibana 的 Dev Tools,使用 DELETE 命令删除不需要的日志。 如下图所示,命令表示删除所有 2020 年 8 月分的日志。
小结
本篇文章主要介绍利用 EFK 收集 Kubernetes 集群日志,主要介绍各个组件的功能和基础设置,并非生产环境可用。需要在生产环境中使用,请参见高可用 EFK 日志收集。
 工具 - 打造 Mac “完美”终端(Terminal),一篇就够了